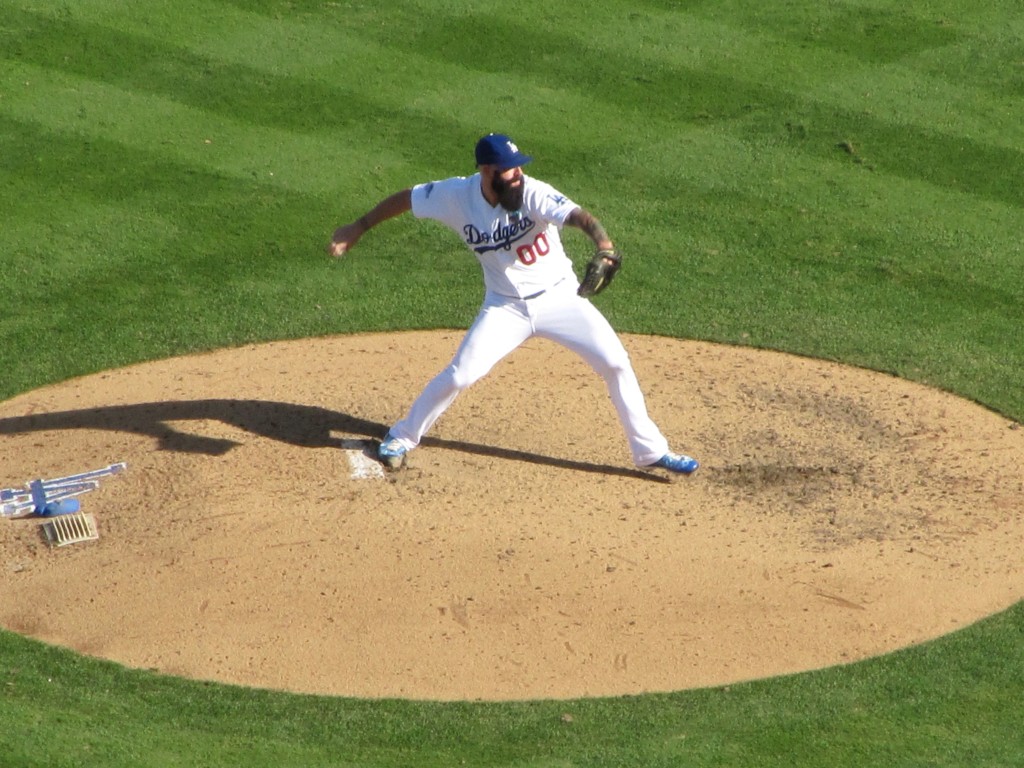
One of the most fun aspects of this blog (for me) is that I’m learning as I write. Digging further into the statistics on my own is exposing me to new things that I wasn’t expecting. Sometimes, this results in me getting an answer that isn’t as complete as it should be. In the comments in my last piece about Brian Wilson‘s strikeouts, Amy (@SpaceDodgers) pointed out that I did not account for the atbat continuing after a looking strike (that resulted in a looking strikeout) was called a ball. This is a good point, and I’ve adjusted my methods a bit as a result.
The first step was to find out what counts Wilson’s looking strikeouts occurred on. Thanks to baseball reference’s play-by-play data, this task was relatively simple:
| Count |
Looking strikeouts |
| 0-2 |
1 |
| 1-2 |
1 |
| 2-2 |
8 |
| 3-2 |
1 |
| Total |
11 |
As I found in the last post, Wilson’s career looking strikeout rate is 31.7%. So, given that he got 10 strikeouts swinging, 11 strikeouts would become 4.65. The rest of the at-bats would continue with one additional ball.
In order to determine what would happen if the at-bat continued, I used baseball reference’s average count splits for Wilson:
|
Split |
PA |
HR |
BB |
HBP |
SO |
BABIP |
|
After 1-2 |
473 |
3 |
28 |
4 |
209 |
0.281 |
|
After 2-2 |
401 |
4 |
50 |
2 |
156 |
0.323 |
|
Full Count |
278 |
3 |
72 |
1 |
95 |
0.393 |
If a looking strikeout on 0-2 was called a ball (which would occur in the percentage of atbats that did not end in a looking strikeout), then I used the split for results after a 1-2 count. 1-2 became 2-2, 2-2 became 3-2, and 3-2 became a walk.
Here are the results of the adjusted numbers, by count:
|
Looking K count |
Stays looking K |
K later in atbat |
BB later |
HBP later |
HR later |
In play later |
In play, hit later |
|
0-2 |
0.42 |
0.26 |
0.03 |
0.00 |
0.00 |
0.28 |
0.08 |
|
1-2 |
0.42 |
0.22 |
0.07 |
0.00 |
0.01 |
0.27 |
0.09 |
|
2-2 |
3.38 |
1.58 |
1.20 |
0.02 |
0.05 |
1.78 |
0.70 |
|
3-2 |
0.42 |
0.00 |
0.58 |
0.00 |
0.00 |
0.00 |
0.00 |
|
Total |
4.65 |
2.06 |
1.88 |
0.02 |
0.06 |
2.33 |
0.87 |
Given the total change that this adjustment has, I also adjusted Wilson’s IP total. Since the model had 0.87 more hits, 1.88 more walks, 0.02 more HBP, and 0.06 more HR, Wilson would record 2.83 fewer outs if facing the same number of batters. That would adjust his IP count to 18.72 (down from the 19.67 he actually pitched).
Here’s a summary of Wilson’s overall stats, showing the actual results, the old regression method, and the new regression method:
|
|
K% |
K/9 |
BB% |
BB/9 |
FIP |
FIP- |
xFIP |
xFIP- |
|
Actual |
28.8 |
9.61 |
8.2 |
2.75 |
2.02 |
56 |
2.82 |
75 |
|
Old regression |
20.1 |
6.70 |
8.2 |
2.75 |
2.47 |
69 |
3.24 |
85 |
|
New regression |
22.3 |
8.03 |
10.7 |
3.60 |
2.57 |
72 |
3.39 |
89 |
This new method isn’t quite as friendly to Wilson as the previous method. While his strikeouts go up, so do his walks. This results in a higher FIP and xFIP than he had previously. I also calculated FIP- and xFIP- (which I didn’t have before). Even with the new regression, Wilson is an above average pitcher, but not nearly as lights-out as his career peak.
There are still a few problems with these methods. The sample size of Wilson’s 2013 season is pretty small, so this is not an accurate way of projecting Wilson next year. The source data might represent a higher than average level of competition, since 1/3 of the data occured during the postseason. The samples on Wilson’s count splits are pretty small, too. There’s also the possibility that different counts lead to different rates of looking strikeouts (it is already known that different counts have different strike zone sizes). Using Wilson’s career average as opposed to the league average might be a mistake, given changes in run environment, Wilson’s injuries, and the uneven nature of his previous career.
Overall, though, this method gives a bit of a better picture of what happened with Wilson last year. He’s not going to continue getting 50% of his strikeouts looking, so it was fun to see what would have happened if he didn’t.